
One of my favorite libraries in PHP is Carbon. Whenever you have to manipulate dates or do any kind of comparison with dates, Carbon makes it much simpler that it would have been had you only used what is available in the standard PHP library.
As part of a typical job for a software engineer, you may be tasked with creating a time series report. This might be for generating a report for the number of sales per day, how many people signed up for your SaaS product each week, or tracking the number of visits you have on your site each hour.
Carbon has built in features that make it super easy to create reports on any timescale, guaranteeing that no time points are missed. Let’s start with a simple example:
$sales = [
    [
        "vehicle" => "Ford Bronco",
        "date" => "2025-01-08",
        "sales" => 3,
    ],
    [
        "vehicle" => "Ford Expedition",
        "date" => "2025-01-06",
        "sales" => 10,
    ],
    [
        "vehicle" => "Ford Bronco",
        "date" => "2025-01-07",
        "sales" => 4,
    ],
    [
        "vehicle" => "Ford Edge",
        "date" => "2025-01-27",
        "sales" => 1,
    ],
    [
        "vehicle" => "Ford Escape",
        "date" => "2025-01-24",
        "sales" => 7,
    ],
    [
        "vehicle" => "Ford Bronco",
        "date" => "2025-01-18",
        "sales" => 4,
    ],
    [
        "vehicle" => "Ford Explorer",
        "date" => "2025-01-30",
        "sales" => 3,
    ],
    [
        "vehicle" => "Ford Mustang",
        "date" => "2025-01-25",
        "sales" => 7,
    ],
    [
        "vehicle" => "Ford F-150",
        "date" => "2025-01-28",
        "sales" => 9,
    ],
    [
        "vehicle" => "Ford F-150",
        "date" => "2025-01-21",
        "sales" => 2,
    ],
];
$report = [];

foreach ($sales as $sale) {
    if (!array_key_exists($sale["date"], $report)) $report[$sale["date"]] = 0;

    $report[$sale["date"]] += $sale["sales"];
}

ksort($report);

# ========== #

$report === [
    "2025-01-06" => 10,
    "2025-01-07" => 4,
    "2025-01-08" => 3,
    "2025-01-18" => 4,
    "2025-01-21" => 2,
    "2025-01-24" => 7,
    "2025-01-25" => 7,
    "2025-01-27" => 1,
    "2025-01-28" => 9,
    "2025-01-30" => 3,
];
Now that works just fine, but if you were to plug this data into a graph, you would end up with something that probably won’t be acceptable:
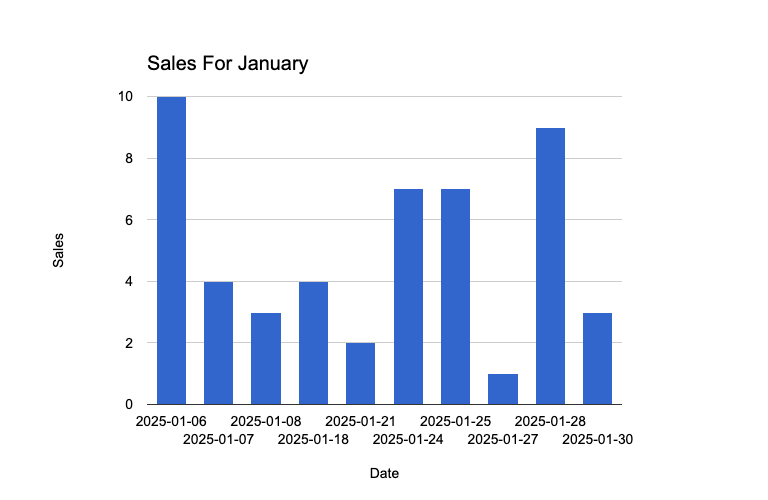
The issue here is that when we graph this data, it appears that sales happen consistently throughout the month, when in reality, there are days with zero sales that aren't being represented. Without including those missing days, our chart would be misleading. So, how can we easily include the dates with no sales? Well, carbon makes it pretty easy:
//...

$reportStart = new Carbon\CarbonImmutable('2025-01-01');
$reportEnd = $reportStart->endOfMonth();
$interval = Carbon\CarbonInterval::day();

// Prefill the report
foreach ($reportStart->range($reportEnd, $interval) as $date) {
    $report[$date->toDateString()] = 0;
}

// Sum the sales
foreach ($sales as $sale) {
    $report[$sale["date"]] += $sale["sales"];
}

// No ksort needed any more

# ========== #

$report === [
    "2025-01-01" => 0,
    "2025-01-02" => 0,
    "2025-01-03" => 0,
    "2025-01-04" => 0,
    "2025-01-05" => 0,
    "2025-01-06" => 10,
    "2025-01-07" => 4,
    "2025-01-08" => 3,
    "2025-01-09" => 0,
    "2025-01-10" => 0,
    "2025-01-11" => 0,
    "2025-01-12" => 0,
    "2025-01-13" => 0,
    "2025-01-14" => 0,
    "2025-01-15" => 0,
    "2025-01-16" => 0,
    "2025-01-17" => 0,
    "2025-01-18" => 4,
    "2025-01-19" => 0,
    "2025-01-20" => 0,
    "2025-01-21" => 2,
    "2025-01-22" => 0,
    "2025-01-23" => 0,
    "2025-01-24" => 7,
    "2025-01-25" => 7,
    "2025-01-26" => 0,
    "2025-01-27" => 1,
    "2025-01-28" => 9,
    "2025-01-29" => 0,
    "2025-01-30" => 3,
    "2025-01-31" => 0,
];
All we have to do is define the range, the interval of the range, and pre-fill the report. Super easy! And now we have an accurate graph:
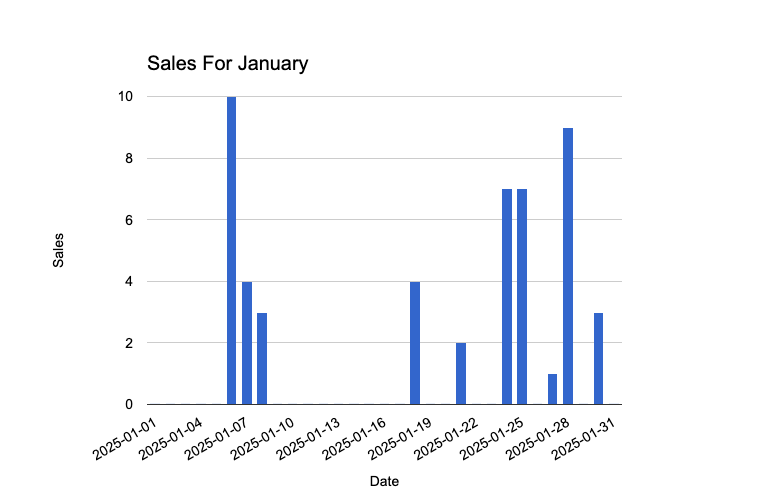
Well… It’s not actually accurate. Dealerships aren’t legally allowed to be open on Sundays in the US. This report shows 0 sales for each Sunday, which makes it look like the sales people are doing worse than they actually are. How can we fix that?
By default, Carbon has built-in intervals, like every day, week, or month. But what if we need a custom rule, such as skipping Sundays? We can define our own interval function using a closure that controls how each step in the sequence moves forward. This lets us customize behavior beyond Carbon’s built-in intervals:
//...
$report = [];
$reportStart = new Carbon\CarbonImmutable('2025-01-01');
$reportEnd = $reportStart->endOfMonth();
// Here we define our custom interval, skipping Sundays
$interval = new Carbon\CarbonInterval(function (Carbon\Carbon $date, $subtract = false) {
$count = $subtract ? -1 : 1;
// Move forward in the sequence
$date->addDays($count);
// If the next day is Sunday, move forward again
return $date->isSunday() ? $date->addDays($count) : $date;
});
// Prefill the report
foreach ($reportStart->range($reportEnd, $interval) as $date) {
$report[$date->toDateString()] = 0;
}
// Sum the sales
foreach ($sales as $sale) {
$report[$sale["date"]] += $sale["sales"];
}
# ========== #
$report === [
"2025-01-01" => 0,
"2025-01-02" => 0,
"2025-01-03" => 0,
"2025-01-04" => 0,
"2025-01-06" => 10,
"2025-01-07" => 4,
"2025-01-08" => 3,
"2025-01-09" => 0,
"2025-01-10" => 0,
"2025-01-11" => 0,
"2025-01-13" => 0,
"2025-01-14" => 0,
"2025-01-15" => 0,
"2025-01-16" => 0,
"2025-01-17" => 0,
"2025-01-18" => 4,
"2025-01-20" => 0,
"2025-01-21" => 2,
"2025-01-22" => 0,
"2025-01-23" => 0,
"2025-01-24" => 7,
"2025-01-25" => 7,
"2025-01-27" => 1,
"2025-01-28" => 9,
"2025-01-29" => 0,
"2025-01-30" => 3,
"2025-01-31" => 0,
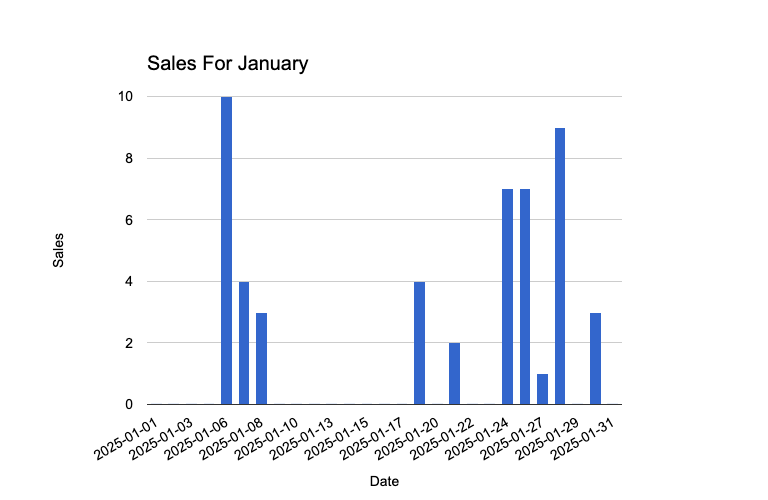
];In the result, you’ll see that 01/05, 01/12, 01/19, and 01/26 are all missing. That is because those are Sundays and we have skipped them. We did that by defining our own CarbonInterval. To define our own CarbonInterval, we pass a closure to the constructor. The closure accepts 2 arguments: a Carbon\Carbon instance representing the datetime that you are starting from, and a boolean, representing whether you are moving forward or backward in the timeline.
In our interval, we are detecting if the next date in the series is a Sunday. If it is, then we skip it and move on. That results in a much more accurate representation of the actual performance of the sales people. 🎉 🎉 🎉
This approach is great for businesses where certain time periods should be ignored, such as car dealerships (closed Sundays). With Carbon, you can apply similar logic to business hours, holidays, or even time zones, for more accurate reporting.
Carbon has many useful built-in intervals. This makes it very easy to allow your end-users to choose their own interval when displaying your graph. For example, you could allow them to aggregate the data by day, week, or month; or by hour, minute, or second; or whatever else might fit your needs.